Aftermarket opportunities abound as sweet spot continues to grow.
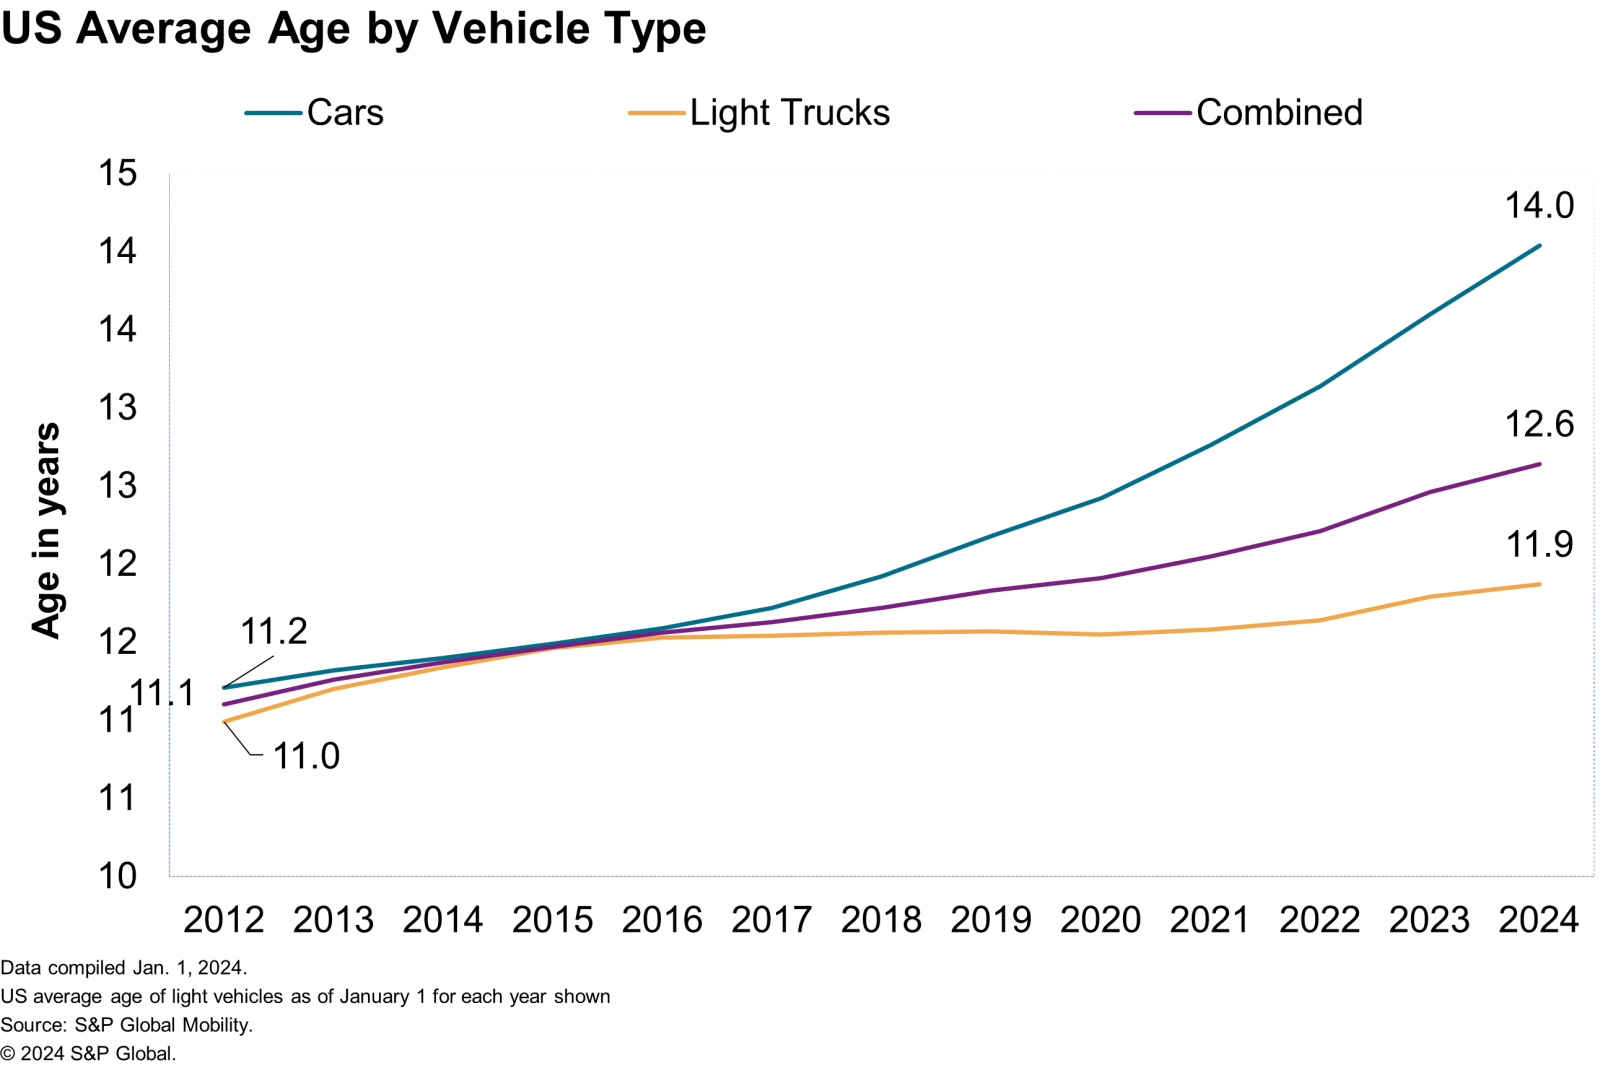
Vehicles on the road are getting even older, according to S&P Global Mobility. The average age of cars and light trucks in the United States has risen again to a new record of 12.6 years in 2024, up by two months over 2023, according to new analysis.
The increase in average age is showing signs of slowing as new registrations normalize. This continues to improve business opportunities for companies in the aftermarket and vehicle service sector in the US, as repair opportunities are expected to grow alongside vehicle age.

Why is the average age of vehicles growing?
New vehicle prices remain prohibitively high for many consumers in the US, with average transaction price reported at US $47,218 in March 2024, according to S&P Global Mobility. Additionally, inflation is proving more persistent than expected and there is trepidation around the shift to electric vehicles. A combination of these factors has resulted in consumers keeping their vehicles on the road longer, driving average age upward.
Growth of the repair business sweet spot
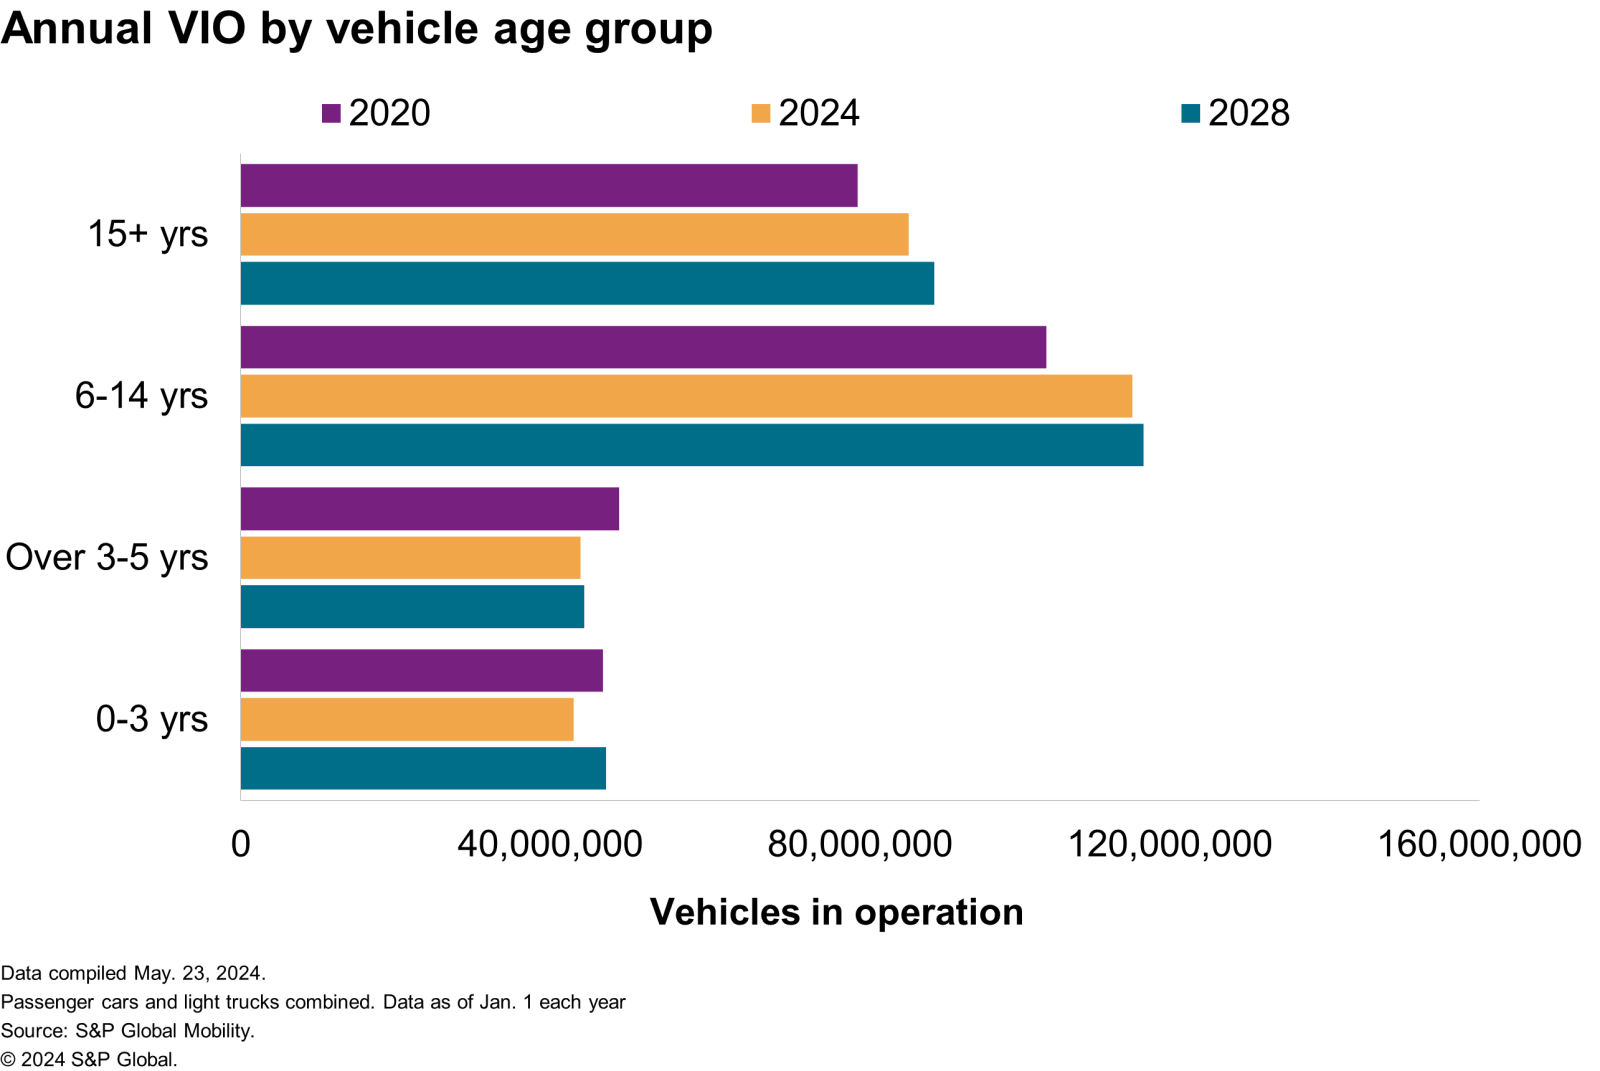
As vehicles are retained longer, the aging fleet is expected to provide additional vehicles to the aftermarket for repairs and maintenance. The 6-to-14-year-old cohort is expected to be 12% higher in 2028 compared to 2020, according to S&P Global Mobility estimates. These vehicles may be on their second or third owner and are likely to already be a prime aftermarket customer. Vehicles older than 15 years are seen growing at a similar pace over the same timeframe.
"With average age growth, more vehicles are entering the prime range for aftermarket service, typically from 6-to-14 years of age," said Todd Campau, aftermarket practice lead at S&P Global Mobility. "With more than 110 million vehicles in that sweet spot — reflecting nearly 38% of the fleet on the road — we expect continued growth in the volume of vehicles in that age range to rise to an estimated 40% through 2028."

Meanwhile, the aftersales business, which typically depends on the 0-to-3-year-old vehicles, is seeing a decline in addressable car parc. From accounting for close to 17% of the on-road fleet in 2020, the vehicles in the younger age category declined to nearly 15% of the fleet as of January 2024. Notwithstanding a slight revival in the near term, volumes in this cohort will continue to remain lower than the pre-pandemic levels (47 million in 2028 vs nearly 50 million in 2019).
The aftersales segment witnessed a slight decline in the volume of repair orders last year. New-vehicle dealerships in the US wrote 264.3 million repair orders in 2023, down slightly from 265.8 million repair orders written in 2022, according to the 2023 National Automobile Dealers Association (NADA) Data full-year report. Meanwhile, total service parts and sales revenue for new vehicle dealerships touched $142.62 billion in 2023, up 3.73% year-on-year, the report added. Even as revenue has climbed consistently since 2020, the pace of growth seems to have moderated with last year's growth being the slowest in three years.
Two passenger cars scrapped for every new passenger car registration
Vehicle scrappage rates — the measure of vehicles exiting the active population — continue to hold steady. As of January 2024, the scrappage rate was 4.6%, largely unchanged from 4.5% in January 2023.
Looking at the mix of the fleet, since 2020, more than 27 million passenger cars have exited the US vehicle population, while just over 13 million new passenger cars have been registered. At the same time, over 26 million light trucks (including utilities) have been scrapped and nearly 45 million registered.
"Consumers have continued to demonstrate a preference for utility vehicles and manufacturers have adjusted their portfolio accordingly, which continues to reshape the composition of the fleet of vehicles in operation in the market," said Campau.
A look at the scrappage trend for alternative fuel vehicles indicates that hybrids are rapidly growing in the fleet with such vehicles gaining popularity among consumers. According to S&P Global Mobility data, as of January 2024, only 18% of new hybrids are replacing the old ones leaving the fleet, while 50% of the new diesels are replacing the old diesels being scrapped. One of the factors driving growth in hybrids is that they are a natural stepping stone in the direction of EVs as well as the fact that they are an advanced propulsion technology that offers some electric driving capability.
The fact that the US is selling more hybrids than it is scrapping is also indicative of the US consumer trend of taking a half-step in choosing a hybrid instead of moving directly to an electric vehicle (EV) when migrating from their internal combustion engine vehicles. Between January 2021 to January 2024, hybrid vehicle registration in the US jumped 181% to 1.4 million, according to S&P Global Mobility data.
VIO grows to 286M, while EV VIO exceeds 3M
The US vehicle fleet surged to 286 million vehicles in operation (VIO) in January, up 2 million over 2023, but the distribution of vehicles by age is changing. Vehicles under the age of six accounted for 98 million vehicles in 2019, or about 35% of VIO. Today they represent less than 90 million vehicles and are not expected to reach that threshold again until 2028 when they will represent about 30% of VIO, according to S&P Global Mobility estimates. This is driven by the impact of COVID and subsequent supply chain shortages that disrupted vehicle supply and registrations — and following historically high volumes from 2015 to 2019.
As a result, the primary driver of VIO growth will be vehicles in the aftermarket 'sweet spot' — vehicles 6-to-14 years of age, and even older vehicles, that are expected to represent about 70% or more of VIO for the next five years. These vehicles will serve as a tailwind to aftermarket service opportunities.
EVs on the road also continued to increase, with 3.2 million EVs in operation in January. 2023 EV registrations surpassed one million units for the first time and increased about 52% compared with 2022. The rate of EV growth was slower than some automakers had anticipated, and there is potential for the average age of EVs to rise in the short term as consumer adoption slows. The average age of EVs in the US is 3.5 years and has been holding largely steady since 2019 with new registrations representing a large share of overall EV VIO.
"We started to see headwinds in EV sales growth in late 2023, and though there will be some challenges on the road to EV adoption that could drive EV average age up, we still expect significant growth in share of electric vehicles in operation over the next decade," said Campau.
Authors: Nishant Parekh, Senior Research Analyst, Automotive Supply Chain, Technology and Aftermarket (nishant.parekh@spglobal.com) and Todd Campau - Aftermarket Practice Lead, S&P Global Mobility (Todd.Campau@spglobal.com)